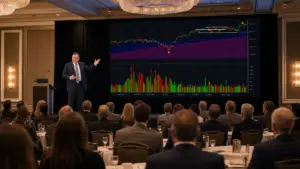
If there’s one lesson I’ve learned after more than thirty years of helping clients generate retirement income, it’s that the stock market is driven as much by human emotion as it is by corporate earnings. Fear, greed, hope, panic, and optimism have moved markets for centuries, and they continue to do the same today. That’s why I believe charts are one of the most valuable tools an investor can learn to use.
The moment some retirees hear me speak about technical analysis or chart reading, they immediately tune me out. They imagine mysterious squiggly lines, complicated indicators, or traders trying to predict the future, but that’s not what charts are. They record what buyers and sellers are actually doing with their money, and that’s an important distinction – especially if you are trying to recreate your paycheck in retirement.
Every trade requires both a buyer and a seller. When buyers become more aggressive than sellers, prices rise. When sellers overwhelm buyers, prices fall. Charts allow us to watch that battle unfold.
Imagine you’re selling your home through an auction instead of listing it with a real estate agent. If only one buyer shows up, you’re probably not going to get the price you were hoping for. But if thirty eager buyers compete against one another, the final selling price will likely be much higher.
The stock market works exactly the same way.
Every day, millions of investors compete to buy and sell shares of great companies. Their collective decisions—not television commentators, economists, or even financial advisors—determine the price. Charts simply record the results of that auction. That’s why I pay so much attention to them. They’re one of the few places where opinions disappear and facts begin.
Generate Consistent Retirement Income Through Bull & Bear Markets Using Charts
One of the reasons chart analysis has remained effective for more than a century is remarkably simple. People haven’t changed. Yes, technologies and industries change, and companies come and go. Human emotions don’t.
Whether you’re looking at Dutch Tulip Mania, the Roaring Twenties, the dot-com bubble, the housing crisis, or today’s excitement surrounding artificial intelligence, the emotional cycle looks remarkably similar. Optimism becomes excitement; excitement turns into greed; greed eventually gives way to fear; and fear often ends in panic.
The headlines change. The technology changes. Human behavior doesn’t. That’s why chart patterns continue to repeat decade after decade. They’re visual records of human behavior. Once you understand that, charts become much more than lines on a screen. And for an investor needing consistent retirement income, that can be an enormous advantage.
A Basic Example: The Cup with Handle
I’m not suggesting that everyone needs to become an expert in technical chart analysis. However, recognizing a few of the most common chart patterns can give you an advantage. One of the first patterns I ever learned—and one that has stood the test of time—is the Cup with Handle.
The name describes exactly what it looks like. Imagine viewing a coffee cup from the side: a rounded bowl followed by a small handle. The way this pattern was first explained to me has always stuck in my mind.
A husband receives a phone call at work from his broker with a “can’t-miss” stock tip. Excited by the opportunity, he buys shares immediately—without mentioning it to his wife. Of course, he isn’t the only one receiving the call. Brokers across the firm are pitching the same stock to hundreds of clients, creating a surge of buying that pushes the price sharply higher.
That evening, he proudly tells his wife that this investment is going to buy them a beach house. For a few weeks, everything looks wonderful as the stock continues climbing. Then the selling begins.
The brokers who promoted the stock—and many early investors—start taking profits. The stock begins to decline. Rather than selling, the husband reassures his wife by saying, “Honey, we haven’t lost anything because we haven’t sold. I’ll just sell when it gets back to where I bought it.”
He’s not alone. Thousands of investors are thinking exactly the same thing.
Eventually, the selling pressure fades and the stock begins recovering. As it approaches its previous high, many of those investors who promised themselves they would get out even finally sell. Their selling temporarily stalls the advance, creating a short pullback or sideways consolidation. This is the handle.
Once those sellers have finished exiting, something important happens. If the company’s fundamentals remain strong and institutional investors continue accumulating shares, buying demand can once again exceed selling pressure. When the stock breaks above the top of the handle on heavy trading volume, it signals that supply has been absorbed and a new advance may be underway.
That’s why the Cup with Handle is considered one of the most reliable continuation patterns and a great one to generate retirement income.
The pattern develops in four basic stages:
• Prior Uptrend: The stock has already established a strong upward trend.
• The Cup: A healthy correction forms a smooth, rounded bottom rather than a sharp collapse.
• The Handle: Near the old high, the stock pauses and drifts slightly lower as remaining sellers exit.
• The Breakout: The stock moves above the handle’s resistance on strong volume, often signaling the beginning of the next leg higher.
The Cup with Handle isn’t a guarantee that a stock will rise—no chart pattern is. But when it appears in companies with strong earnings, rising sales, and increasing institutional demand, it has historically been one of the more successful patterns used by growth investors.
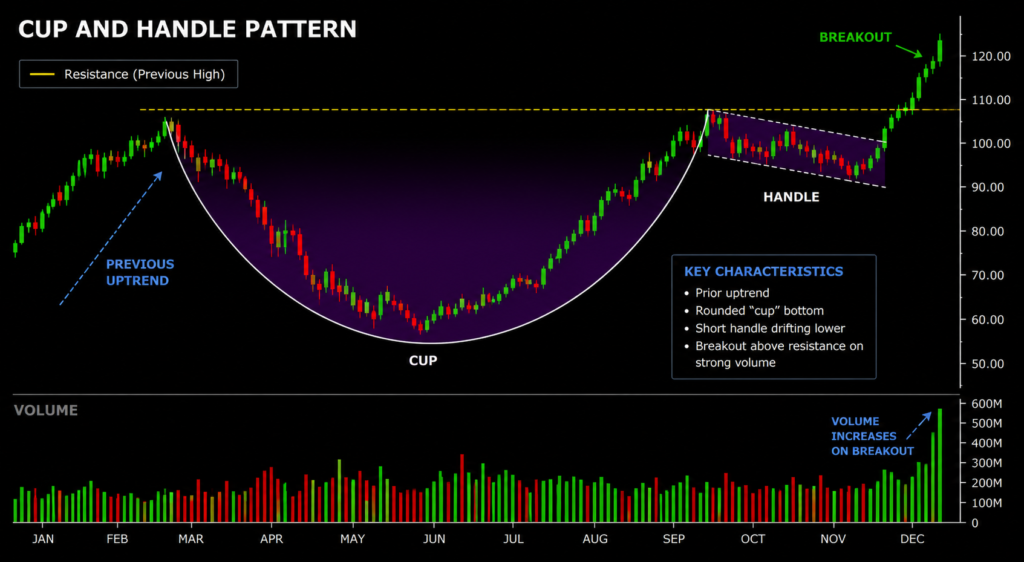
The basic structure of a Cup with Handle pattern.
Over the years, I’ve taught this pattern in countless seminars. Every time I tell this story, I see wives smiling and husbands looking down at the floor. Everyone laughs because they’ve lived some version of it. That’s exactly why the pattern has endured for decades. Markets change, but human nature doesn’t.
Why I Use Both Technical and Fundamental Analysis to Generate Retirement Income
Some investors believe you have to choose between fundamental analysis and technical analysis. I don’t. I use both. Fundamental analysis answers the question of what you should buy, while technical analysis provides when you should buy it.
Fundamental analysis attempts to determine a company’s intrinsic value by examining its earnings, sales growth, balance sheet, competitive position, management team, and economic conditions. Technical analysis studies price and volume to identify when institutional investors are accumulating—or distributing—shares. In my experience, the best investment decisions occur when both methods point in the same direction.
A great company purchased at the wrong time can still produce disappointing returns. Likewise, a beautiful chart can’t rescue a company with deteriorating fundamentals. When the fundamentals and the technicals agree, you’ve dramatically improved the odds in your favor.
The Bottom Line
The best investors don’t choose between fundamentals and charts—they use both. One tells you whether a company deserves your money. The other tells you whether the market agrees. When quality and timing come together, that’s where exceptional investment opportunities are often found.
No investment strategy works 100 percent of the time. Neither fundamental analysis nor technical analysis can guarantee success on every investment. But both approaches influence how millions of investors make decisions, and that often creates a self-fulfilling effect.
For example, if a stock repeatedly reverses at the same price level, many traders begin expecting another reversal. They place buy or sell orders accordingly.
Because prices are determined by supply and demand, those collective decisions can actually cause the reversal to happen. Does it work every time? Absolutely not. Does it provide a statistical edge? Often, yes. And investing is a game of probabilities, not certainties. Small advantages, consistently applied over decades, can produce extraordinary results.
Compare that to buying stocks blindly at any price. We don’t make major purchases that way anywhere else in life. When buying a home, a car, or even a television, price is one of the first things we consider. We determine what we’re willing to pay and then wait patiently for the opportunity.
Yet many advocates of a strict “buy-and-hold-no-matter-what” philosophy suggest purchasing stocks regardless of market conditions or valuation. That ignores one of the most basic principles of investing: Price matters – especially when trying to generate consistent retirement income.
The goal is to buy great companies at attractive prices that fit in your overall financial plan – and then to sell them for a profit to generate retirement income. Technical analysis can be invaluable in making those decisions. An advisor’s approach to investing should be understandable before you commit your assets. Some firms construct broadly diversified portfolios and make infrequent adjustments.
At Studdard Financial, we believe in daily, active portfolio management to generate retirement income. We are a fee-only fiduciary registered investment adviser that uses fundamental analysis to evaluate companies and sectors, along with technical chart analysis, to make informed trading decisions. Those tools involve judgment and cannot eliminate risk, but they reflect an active, disciplined process rather than a one-size-fits-all buy-and-hold allocation.
Byron’s Rule For Recreating Your Paycheck
Great companies make great investments only when bought at the right time and the right price. Fundamentals tell you what to buy. Charts help tell you when.
Byron L. Studdard is a CERTIFIED FINANCIAL PLANNER® professional and the founder of Studdard Financial, a fee-only fiduciary registered investment adviser serving clients from coast to coast from offices in Sarasota, FL and Memphis, TN. For more than thirty years, he has provided personalized investment advice, long-term wealth-building strategies, retirement planning guidance, and intergenerational wealth-transfer support to clients seeking disciplined, trustworthy financial oversight. His writing has been featured on the websites of ABC News, Good Morning America, and Yahoo. He can be reached at Byron@StuddardFinancial.com.
All information provided is for educational purposes only and does not constitute investment, legal or tax advice; an offer to buy or sell any security or insurance product; or an endorsement of any third party or such third party’s views. The information contained herein has been obtained from sources we believe to be reliable but is not guaranteed to be accurate or complete. Studdard Financial, LLC does not offer tax or legal advice, but might refer clients to independent accounting, tax, or legal professionals.
Whenever there are referrals to other professional advisors, or references or hyperlinks to third-party content (including but not limited to tax and legal), this is intended to provide additional perspective and should not be construed as an endorsement of any services, products, guidance, individuals, or points of view. All examples are hypothetical and for illustrative purposes only. Please contact us for more complete information based on your personal circumstances and to obtain personal individual investment advice. Carefully consider your investment objectives, risk factors, and charges and expenses before investing. Investing involves risk, including possible loss of principal. Consult your own advisor about the implications of investing. Diversification and asset allocation may not protect against market risk. Past performance is never a guarantee of future returns. Investing in foreign stock markets involves additional risks, such as the risk of currency fluctuations.
Not FDIC Insured * No Bank Guarantee * May Lose Value
Copyright Studdard Financial © 2026 · All Rights Reserved