Where is the stock market likely to go next?
While no indicator can predict the future with certainty, support and resistance lines provide valuable clues about where buyers and sellers are likely to step in. These price levels are among the oldest tools in technical analysis, helping investors make more informed decisions about buying, selling, and managing risk. It is important to remember that while they are reliable, they aren’t perfect. No investment philosophy or strategy can guarantee a profit or prevent a loss. Furthermore, this is only one tool of many and doesn’t take into account fundamental analysis.
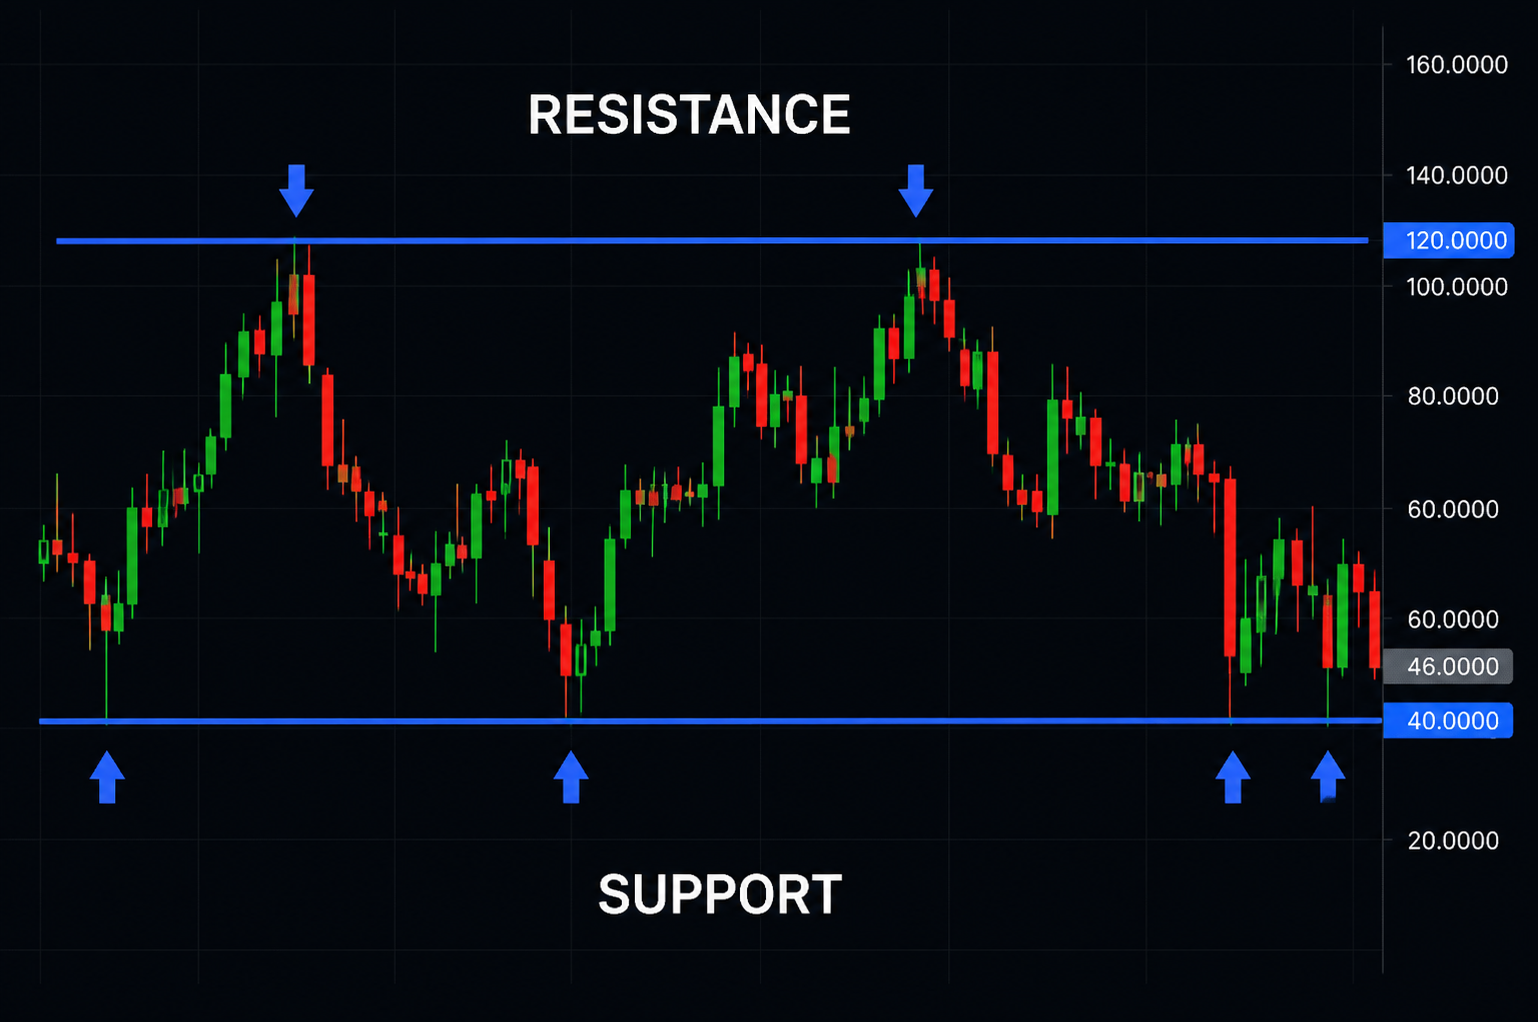
Support and Resistance Lines
What Is Support?
Support is a price level where a security tends to stop falling because there are more buyers at that price than sellers.
Think of support as a floor beneath a stock’s price. When prices decline toward this level, investors often see value and begin buying, causing the decline to slow or reverse.
In the chart above, the stock repeatedly bounces near $40, so many traders would refer to that as a floor of support.
Why Support Matters
Support levels can help investors:
- Identify potential buying opportunities
- Set stop-loss orders below important price levels
- Measure downside risk before entering a trade
However, support is not permanent. If the fundamentals (things like sales and earnings) decline, then the selling pressure might be great enough to break through the floor which can lead to a sharp move lower.
What Is Resistance?
Resistance is the opposite of support.
It is a price level where upward momentum slows because there are more sellers than buyers. Investors who bought at lower prices may begin taking profits – or even shorting the stock (betting it goes down in price).
Imagine resistance as a ceiling that the stock struggles to break through.
In the chart above, the stock repeatedly reaches $120 but fails to move higher, so many traders would refer to that as a ceiling of resistance.
Why Resistance Matters
Resistance levels help investors:
- Identify areas to take profits
- Avoid chasing stocks that may be overextended
- Recognize potential breakout opportunities
When a stock finally closes above resistance on strong volume, it often signals renewed buying interest and the potential for further gains.
The Psychology Behind Support and Resistance
Support and resistance work because markets are driven by human behavior.
Investors remember important price levels.
- Buyers remember where they previously found value.
- Sellers remember where they experienced losses.
- Institutions often place large orders near well-known price levels.
This collective behavior creates recurring areas where supply and demand repeatedly interact.
In many ways, support and resistance represent investor psychology made visible on a chart.
When Support Becomes Resistance
One of the most powerful concepts in technical analysis is the role reversal of price levels.
Imagine a stock falls below an important floor of support level.
Once broken, that former support often becomes new resistance. Investors who bought near the old support may sell if the stock rallies back to their entry price, creating additional selling pressure.
Likewise, when resistance is broken convincingly, it frequently becomes new support.
This transition often confirms that market sentiment has shifted.
Confirming a Breakout
Not every move above resistance—or below support—is meaningful.
False breakouts happen regularly.
Many traders look for confirmation before acting, including:
- A strong daily or weekly close beyond the level
- Higher-than-average trading volume
- Fundamental improvements in the stock
- Multiple closes above resistance
- Momentum indicators supporting the move
The more confirmation present, the greater the probability that the breakout is genuine.
Why Volume Matters
Price tells you what happened.
Volume tells you how much conviction was behind the move.
A breakout above resistance with heavy volume suggests institutional investors are participating, increasing the likelihood that the move will continue.
Conversely, a breakout on light volume is more susceptible to failure.
Risk Management Comes First
No technical level works 100% of the time.
Markets can surprise even the most experienced investors.
Support and resistance should always be used alongside proper risk management.
Before entering any trade, consider:
- Where will you exit if you’re wrong?
- How much capital are you willing to risk?
- Does the potential reward justify the risk?
Successful investing is not about being right every time—it’s about managing losses while allowing winners to grow.
Final Thoughts
Support and resistance levels are more than simple lines on a chart. They represent the ongoing battle between buyers and sellers and provide valuable insight into market psychology.
While these levels cannot predict the future with certainty, they can help investors identify high-probability entry points, manage risk, and recognize potential trend changes.
Whether you’re a long-term investor or an active trader, mastering support and resistance is one of the most valuable skills you can develop. Like any investing tool, they work best when combined with sound risk management, patience, and a disciplined investment strategy.
Investment Disclaimer
The information provided in this article is for educational and informational purposes only and should not be construed as financial, investment, tax, or legal advice. Nothing contained herein constitutes a recommendation, solicitation, or endorsement to buy, sell, or hold any security or investment. All investments involve risk, including the potential loss of principal. Past performance is not indicative of future results, and no investment strategy can guarantee profits or protect against losses in declining markets. The charts, technical analysis, support and resistance levels, moving averages, and other market observations presented are based on historical price data and are intended solely to illustrate technical analysis concepts. Market conditions can change rapidly, and technical indicators should not be relied upon as the sole basis for making investment decisions. Before making any investment decisions, you should conduct your own research, evaluate your financial situation and investment objectives, and consult with a qualified financial advisor or other licensed professional. You are solely responsible for your own investment decisions and the risks associated with them.
The author and publisher assume no liability for any losses or damages arising from the use of the information contained in this publication. You should carefully consider your risk tolerance, time horizon, and financial objectives before making investment decisions. By investing, you run the risk of losing money or losing buying power (where your money does not grow as fast as the cost of living). Investing involves risk and no investing strategy can prevent a loss or guarantee a gain, and our strategies are no different. Risk can be classified into many different categories, and by knowing those categories you can better manage expectations and avoid or reduce certain kinds of risk. This communication is meant to generally summarize the current outlook of the overall market and while it may make references to specific securities owned and/or trading strategies, theories, and philosophies, it is important to note that these are not used in every account or for every client. You should review your own account regularly to ensure it is being managed in the way you desire. Any performance data shown represents past performance, which is not a guarantee of future results. Investment returns and principal value will fluctuate so that investors’ shares, when sold, may be worth more or less than their original cost. Current performance may be lower or higher than the performance data cited. Artificial Intelligence (AI) is used occasionally to generate this content and the chart above was generated using AI and is of the Vanguard Total Stock Market ETF (ticker: VTI) which seeks to track the performance of the CRSP US Total Market Index including large-, mid-, and small-cap equity diversified across growth and value styles. The Center for Research in Security Prices (CRSP) is a vendor of historical time series data on securities. Academic, commercial, and government agencies use CRSP to access information such as price, dividends, and rates of returns on stocks. The FDIC does not insure money invested in stocks, bonds, mutual funds, or municipal securities.
Investment Advisory products/services are offered through Studdard Financial, LLC, a registered investment advisor. By industry regulation, we cannot accept time-sensitive information or orders to execute trades via e-mail, text, fax or voice mail. If you would like to execute a trade or if you have time-sensitive information, please call our office. If you receive any communication including but not limited to an email or text containing ACH or Wire withdrawal instructions, please call our office immediately. Do not click on any text or email link or contact anyone from any email unless we have discussed with you prior. Investing in stocks, bonds, exchange traded funds, mutual funds, and money market funds involve risk of loss. Loss of principal is possible. Some high-risk investments may use leverage, which will accentuate gains & losses. Foreign investing involves special risks, including greater volatility and political, economic and currency risks and differences in accounting methods. A securities or a firm’s past investment performance is not a guarantee or predictor of future investment performance. This electronic message transmission contains information that may be confidential or privileged. If you desire to a copy of our Form ADV, Part 2A brochure or a copy of our privacy policy, please contact us at (901)355-4713 or via email at byron@studdardfinancial.com. The information transmitted by this email is intended only for the person or entity to which it is addressed. This email may contain proprietary, confidential and/or privileged material. If you are not the intended recipient of this message, be aware that any use, review, retransmission, distribution, reproduction or any action taken in reliance upon this message is strictly prohibited. If you received this in error, please contact the sender and delete the material from all computers.
Copyright © 2026 Studdard Financial, LLC, All rights reserved.